The organization in brief:
BNP Paribas Asset Management (BNPP AM) is a leading provider of quality investment solutions for individual, corporate and institutional investors, managing EUR 408 billion in assets as of 31 March 2020. We are ‘the asset manager for a changing world’, because we have organized ourselves to be able to stay at the forefront of developments while maintaining an unwavering focus on what our clients want most – long-term sustainable investment returns, built on the firm foundation of quality assets. BNPP AM has been a major player in sustainable investment since 2002. We have a dedicated multi-disciplinary team within the Sustainability Centre, with financial, economic, and legal expertise.
At BNPP AM, we are working to raise awareness among institutional investors and companies we invest in of the critical importance of preserving biodiversity.
We have taken steps to put greater focus on biodiversity as part of our investment approach:
- BNPP AM has begun assessing the seafood sourcing and plastic/packaging strategies of companies in the consumer sector, adjusting their overall ESG scores and engaging with them to improve best practices. The initial study was conducted in collaboration with the Natural Capital Protocol
- In January 2020, BNPP AM along with AXA IM, Sycomore AM and Mirova launched a joint initiative to develop pioneering tool for measuring investment impact on biodiversity.
From an operational perspective, BNPP AM has set a long-term goal of sending zero waste to landfill, helping to drive resource use reduction and reuse.
Why was this undertaken:
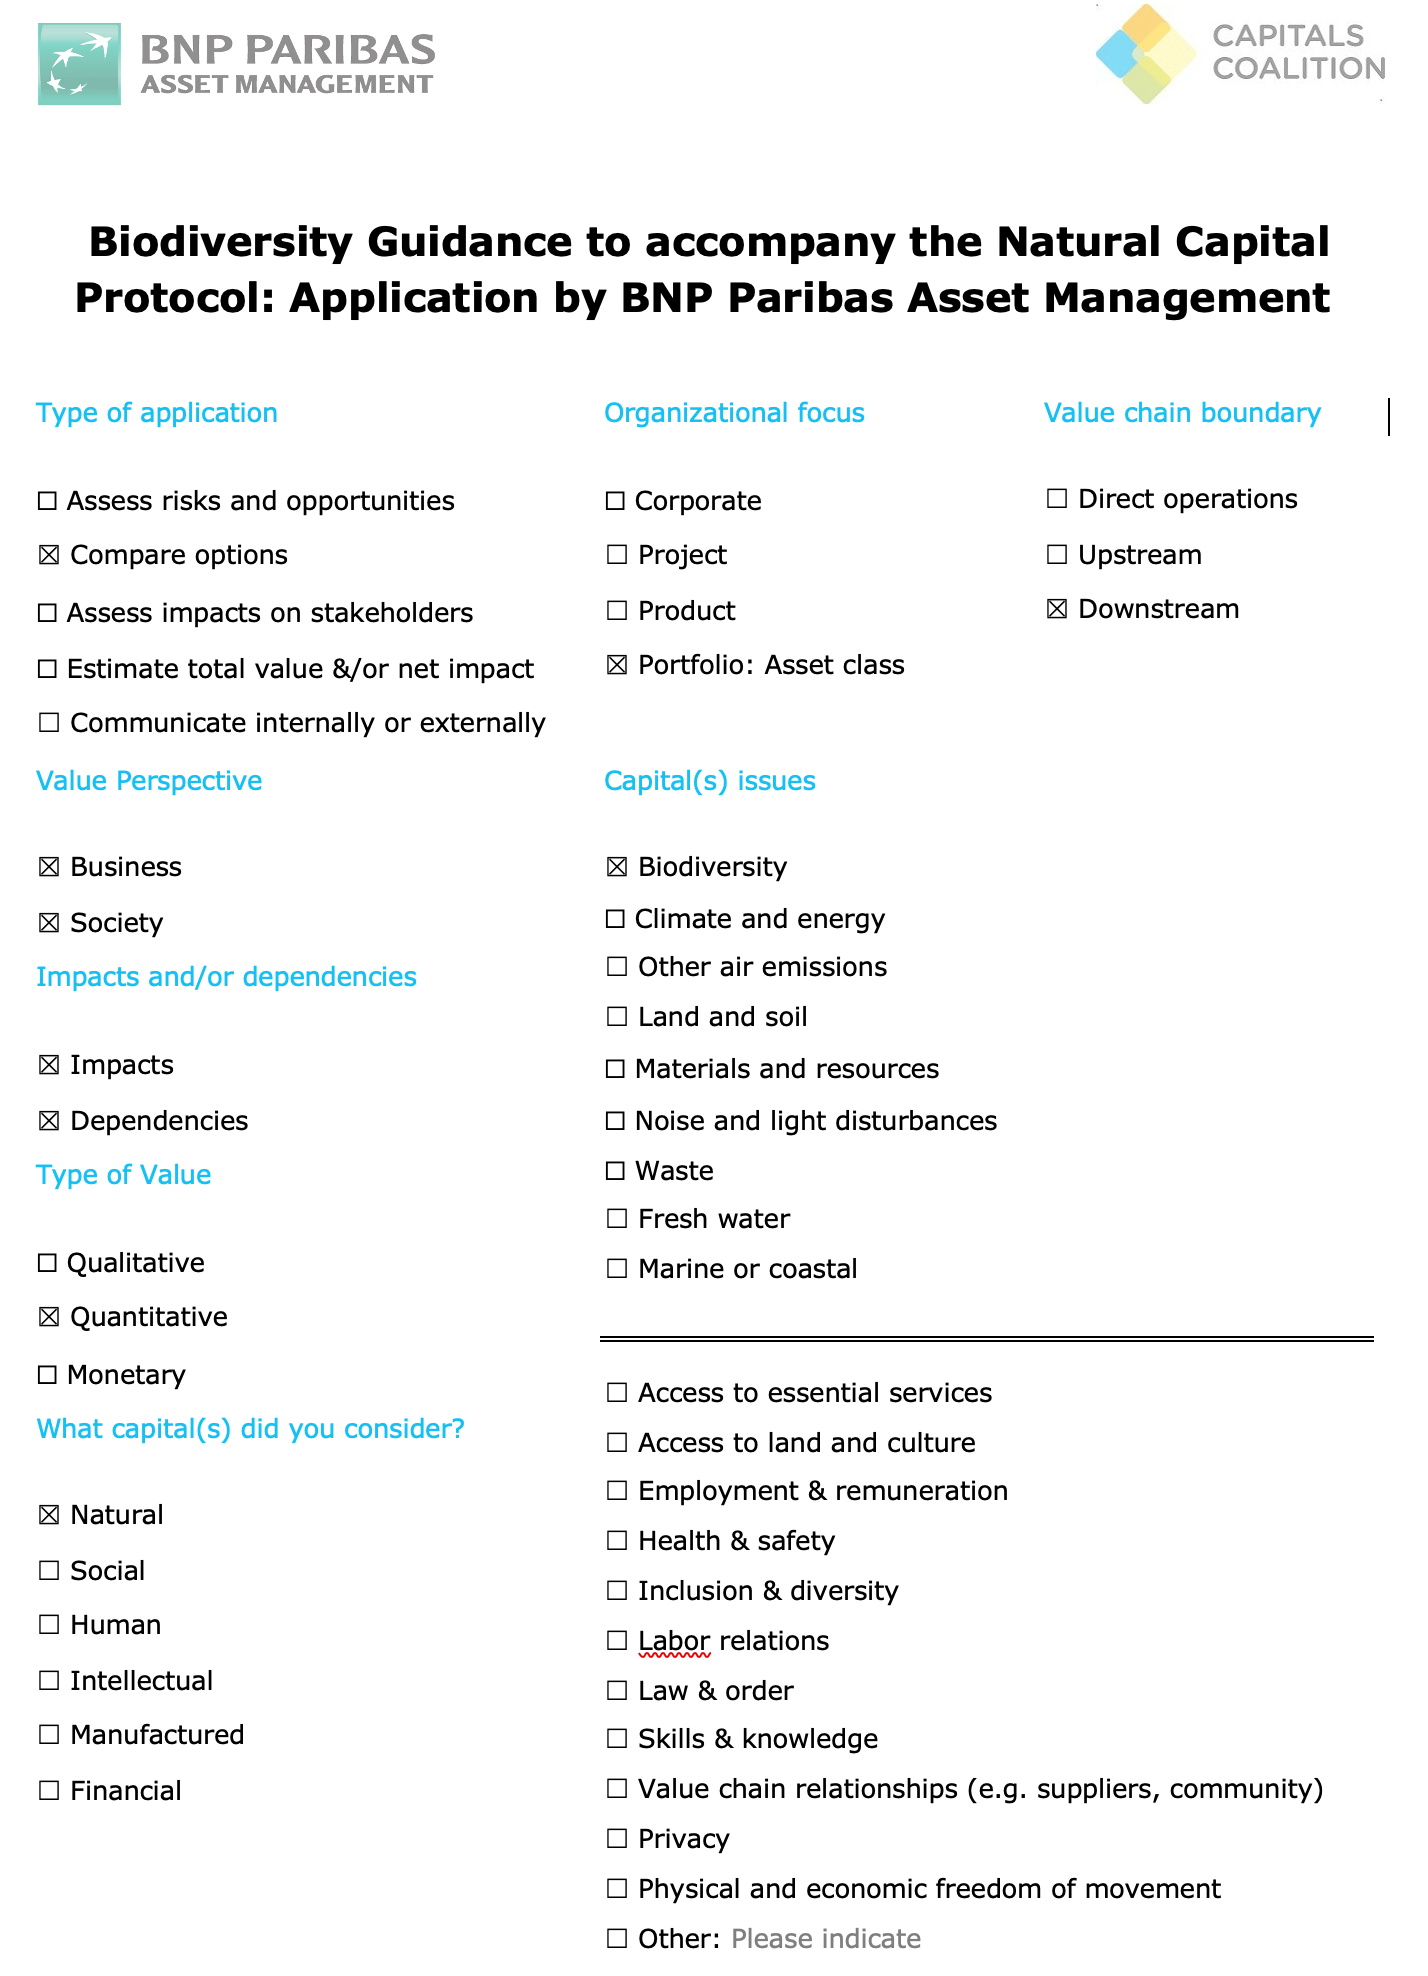
As part of the Biodiversity Guidance to accompany the Natural Capital Protocol, BNPP AM agreed to pilot the process involved in undertaking a biodiversity measurement approach from the perspective of a financial institution’s investment portfolio.
The purpose of the pilot was to identify and assess the different measurement approaches available to financial institutions at the portfolio level and to identify gaps and limitations that exist in these approaches when completing a biodiversity inclusive natural capital assessment. This was achieved through a detailed assessment of various measurement approaches and provided recommendations on how biodiversity measurement approaches can be applied at the portfolio level.
BNPP AM is interested in understanding impact of companies on biodiversity and to better understand the risks associated with their investments.
BNPP AM’s expertise in finance and portfolio management presents the ideal scenario to assess the measurement approaches identified within Step 6 of the Measuring and Valuing Guidance as they work with large portfolios comprised of companies from different sectors and are aware of the challenges facing financial portfolio assessments relating to standardization and comparison.
Upon successful completion of the piloting, it is anticipated that an understanding of how financial institutions can assess biodiversity impacts within their portfolios, the limitations of identified approaches, and an understanding on how to mitigate identified data gaps will be achieved.
How did you measure and value your impacts and/or dependencies?
For this pilot, a mock portfolio of Agribusinesses was developed to test the measurement approaches identified by the measuring guidance. This was completed by focusing on a specific sector. The agriculture sector was chosen due to its known impacts and dependencies on biodiversity, and its alignment with BNPP AM’s prior work piloting a specific measurement approach (the Global Biodiversity Score). The mock portfolio included 8 multinational companies, mostly based on cereals and large-scale crop production.
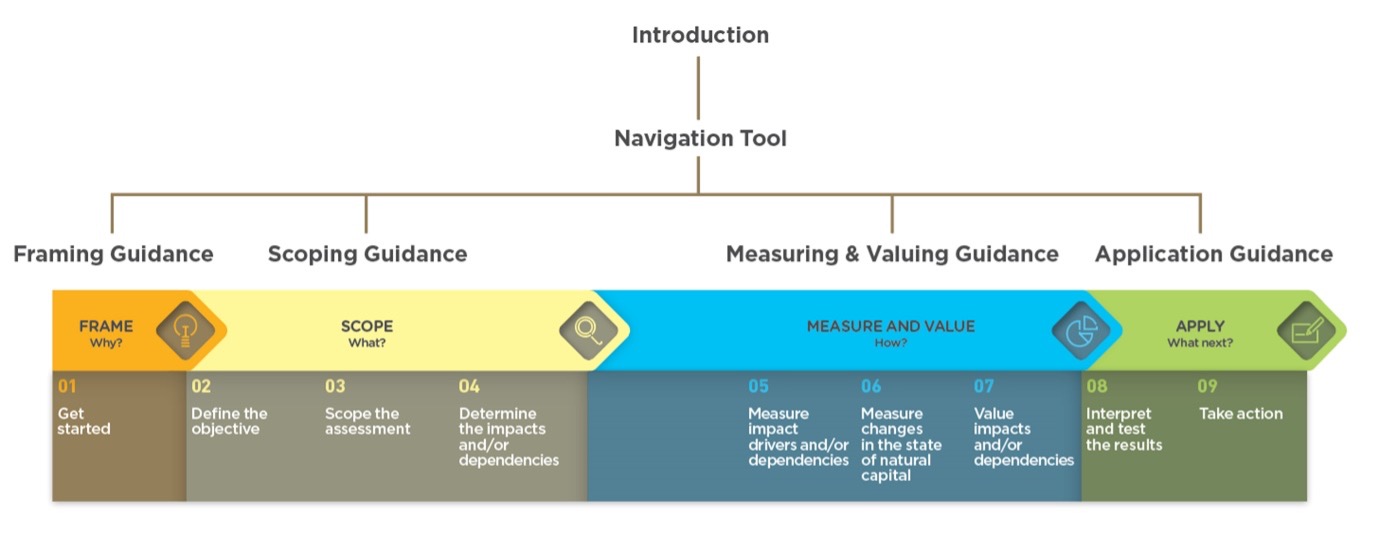
Steps 5 and 6 of the Measuring and Valuing Guidance, together with the Aligning Biodiversity Measures for Business matrix found in this guidance, helped us to identify the measurement approaches most applicable for portfolio assessments. These were the Global Biodiversity Score (GBS), the Biodiversity Footprints for Financial Institutions (BFFI) and the LIFE Impact Index. These were chosen based on their ability to support corporate and portfolio level assessments. Further detail on these approaches is provided in the results section below.
What were the results?
The assessment of biodiversity measurement approaches revealed the importance of combining approaches to provide a robust biodiversity inclusive assessment, using a combination of approaches identified through the Aligning Biodiversity Measures for Business matrix and their ability to fill the required gaps that are outlined below. Utilizing a combined approach will help address the information gaps currently associated with the different measurement approaches available, and will better ensure a comprehensive assessment that includes all the important aspects of biodiversity.
After reviewing the actions outlined in Steps 5 & 6 of the Measuring & Valuing Guidance, the measurement approaches identified by the Aligning Biodiversity Measures for Business matrix as being most applicable for portfolio assessments were; the Global Biodiversity Score (GBS), the Biodiversity Footprints for Financial Institutions (BFFI) and the LIFE Impact Index. These were chosen based on their ability to support corporate and portfolio level assessments. A high-level overview of the gap analysis completed is presented below:
GBS – Corporate biodiversity footprint assessment approach, which assesses impacts of economic activities across their supply chain. The biodiversity impacts are quantified using GLOBIO pressure-state models. The results are given in Mean Species Abundance (MSA)/ KM2, which expresses the % intactness of ecosystems (based on a pristine state). Freshwater impacts have recently been included in the GBS. Limitations: MSA risks missing the threat to particularly endangered or threatened species at a site, as it compares the mean abundance of original species as a % rather than those accounting for independent species vulnerability. GBS also does not account for proximity to High Conservation Value Areas or invasive species. Another limitation is that it does not differentiate between geographical regions, as biodiversity quality is not considered. For example, it gives the same MSA loss in temperate climates as tropical climates, despite the difference in species richness. Marine biodiversity data is also limited and is not fully accounted for in GBS.
BFFI – It uses the ‘EXIOBASE’ database to assess the pressures on biodiversity caused by economic activities, which gives data by country-specific sector averages. The ReCiPe model is used to calculate the impact of these pressures on biodiversity. The results are given in PDF (Potentially Disappeared Fraction of species). Limitations: BFFI currently uses sector average data, which does not help companies differentiate themselves within sectors at a country level. The PDF metric focuses on species richness, without differentiating between endangered or protected species. There is also a limitation in the coverage of marine biodiversity.
LIFE – Tool developed to guide companies to identify, measure, monitor and reduce their impacts and dependencies on natural capital, including biodiversity. Measures both impacts and contributions to reducing impacts at site and international levels. Limitations: MSA risks missing endangered or protected species at the site level and does not account for species vulnerability. The biodiversity component of the framework is based on a global model, so the impacts are not based on regionally specific biodiversity data. The approach is flexible, however, and can accommodate local data.
Additional measurement approaches were assessed based on their ability to resolve the limitations of the primary approaches. These approaches included the Species Threat Abatement and Recovery (STAR) metric, the Biodiversity Impact Metric (BIM) and TRASE Tools. When combined with the approaches described above, it could be possible to address the limitations identified and complete a more robust assessment by including different aspects of biodiversity.
STAR – A species-specific approach which uses the IUCN Red List to calculate the potential reduction in extinction risk of a species present within a specified site. It helps to determine the current threats facing a species and measures the contribution that investments can make to reducing species risk. The approach assesses the extent to which an economic investment can reduce the risk of extinction to taxa listed as ‘threatened’ species at a specific site.
BIM – Focuses on land use impacts only. Uses MSA metric and examines whether commodity sourcing is having a higher or lower impact on biodiversity compared to other locations or the global average. This means that businesses can reduce their impact on biodiversity by assessing the land use, land area or source location of projects. More importantly, the BIM takes biodiversity quality into account and allows direct comparison of potential impacts at different locations and for different commodities.
TRASE – Focuses primarily on supply chain data and is currently focused on the tropic regions and agriculture. It aims to increase transparency and reveal links between environmental data and social risk. It helps to determine the sustainability of different production regions and identify risks. TRASE Finance builds on the TRASE Earth data and information to enable financial institutions to improve the sustainability of portfolios through screening ranking and risk profiling. This tool is still in development and is open source.
Note that limitations of the additional measurement approaches identified have not been considered as they are intended to temporarily fill identified gaps when assessing biodiversity impacts and dependencies at the portfolio level.
What was the outcome of the assessment, and what impact did it have?
The outcome of the pilot shows that biodiversity assessments at the portfolio level are complex. Each method has its own limitations that should be identified when reporting to ensure transparency of results. Portfolios are difficult to assess because each company requires an individual assessment, resulting in different biodiversity impacts and dependencies by the company itself and the supply chain it relies upon.
There are limitations associated with all the measurement approaches, which leads to the suggested use of a combined approach to temporarily fill gaps in an assessment on biodiversity impacts and dependencies.
What were the learnings?
A combination of approaches is needed to cover the spectrum of global biodiversity goals. For example, combining the STAR and GBS measurement approaches would capture information relating to species extinction and ecosystem integrity. Some new measurement approaches under development may be able to fill in significant data gaps (supply chain and consumer use) but are not currently comprehensive enough to fully assess both. BFFI and GBS are similar in their methods and data requirements – however their applicability is heavily dependent upon the objective of the assessment. This highlights the need to use the online Biodiversity Guidance Navigation Tool, to help identify why and what you want to analyze. This will be most important in deciding which measurement approach to use.
Where financial institutions hold large portfolios of companies, biodiversity assessments can be complex and time consuming. For financial institutions to fully assess and compare companies in their portfolio, a standardized approach for biodiversity measurement is considered necessary, but using a single measurement approach will not provide a comprehensive understanding on the impacts to biodiversity. Similarly, using species focused assessments to identify impacts and dependencies on biodiversity at the portfolio level will be difficult in attributing or allocating the impacts to specific companies within the same area. This is a recognized gap even when using a combination of approaches and requires further investigation by measurement approach developers.
Although it is recommended that a combination of tools be used to better assess corporate impacts and dependencies on biodiversity, there is also a need to investigate the use of these tools to ensure the assumptions of each produce results that build upon one another and avoid the misinterpretation of data (e.g. through double counting etc.). Additionally, a measurement approach that works for one company may not be relevant for another. Determining the most viable combination of tools for your specific sector and/or company is therefore important. Ultimately, the combination of approaches is a suggested method to fill current gaps in available approaches, but a more permanent solution will be required.
Next steps:
Learning from this pilot and previous ones, BNPP AM now understands that reducing its footprint and understanding its dependencies when investing in the private sector is a long journey. It requires a combination of measurement approaches to address the current limitations within each individual approach. Now that biodiversity is finally under the spotlight, BNPP AM feels confident that these data gaps will be partially filled. In addition, with the help of specialized data providers with access to corporate data, BNPP AM will be better able to assess its impacts and dependencies on biodiversity.
![]()