The organization in brief
CDC Biodiversité is a French consulting & engineering firm specialized in positive actions for biodiversity, biodiversity sustainable management (biodiversity offsets), and the measurement of corporate biodiversity footprints.
Why was this undertaken?
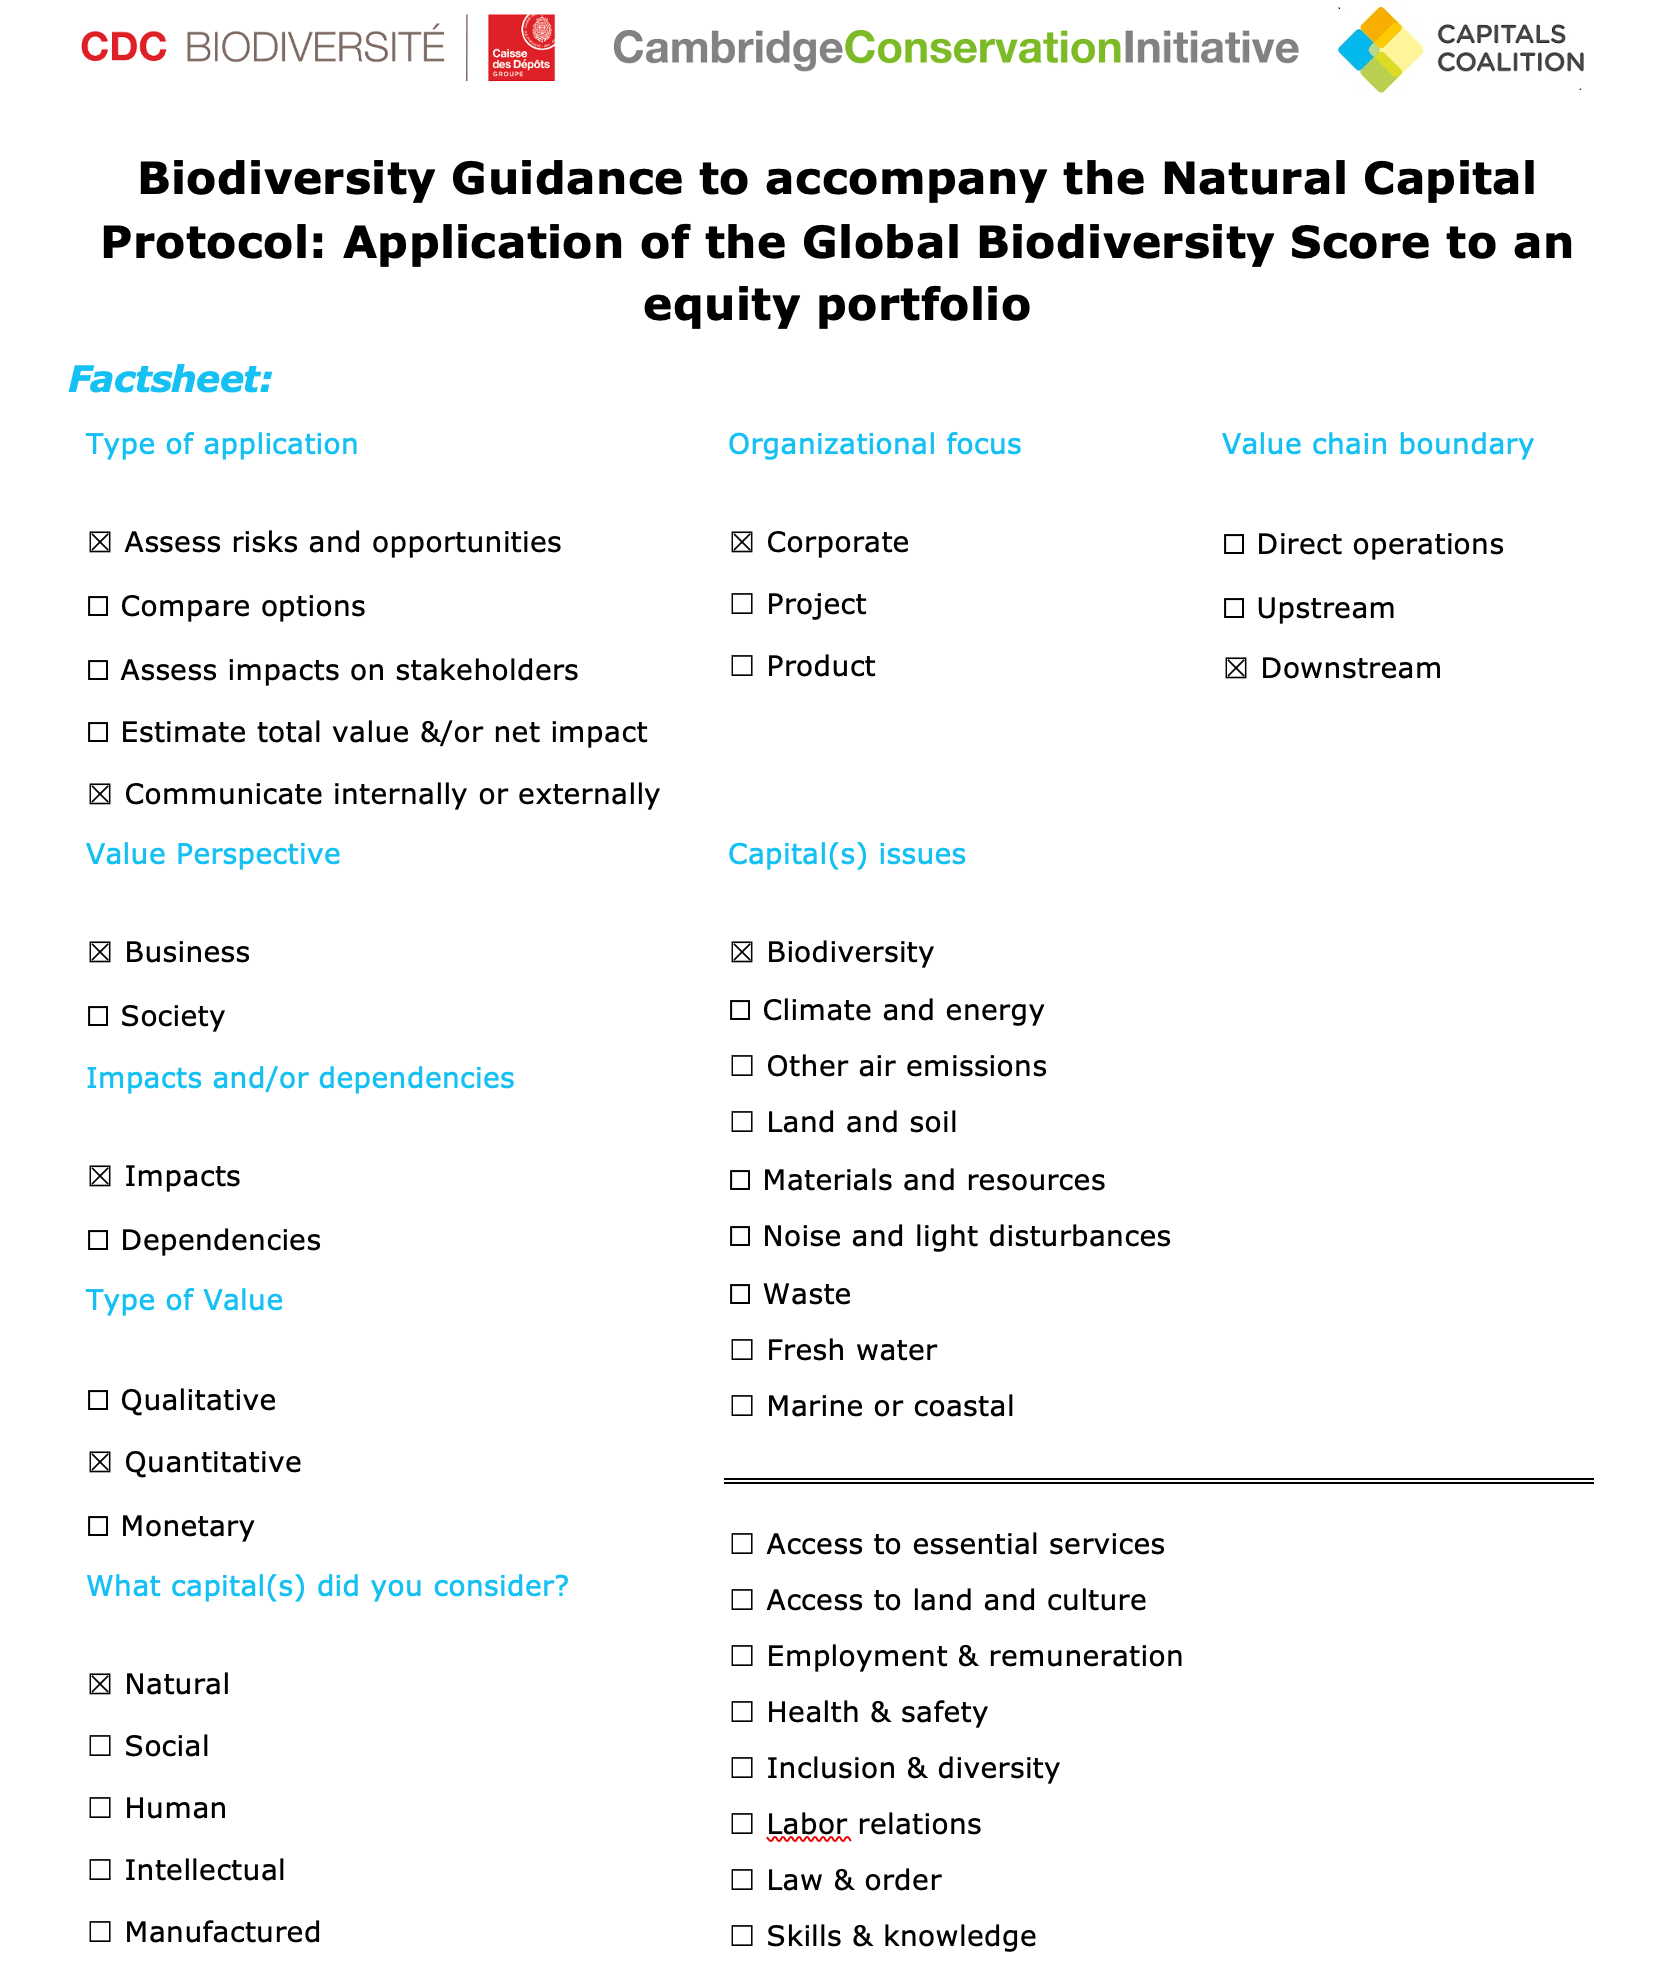
CDC Biodiversité collaborated with several members of the Business for Positive Biodiversity (B4B+) Club to pilot the Global Biodiversity Score corporate biodiversity assessment tool it has been developing. One of the first three pilots was conducted with BNP Paribas Asset Management to explore what could be achieved at this early stage in terms of computation of the biodiversity footprint of a portfolio of listed equities.
What was the scope?
The portfolio assessed gathers 10 companies operating in the agri-food industry (food processing, retail, catering), with a total investment of about EUR 20.1 million.
How did you measure and value your impacts and/or dependencies?
Impacts were measured using an early version of the Global Biodiversity Score (GBS) developed by CDC Biodiversité (with limited capacities at the time). The biodiversity impacts calculated incorporate 4 out of 5 of the IPBES drivers of biodiversity loss (over exploitation, pollution, climate change and land use change) Turnover data from public (annual reports of companies), private (Bloomberg) and internal data was collected by BNP Paribas Asset Management’s ESG analysts. Data was as much as possible broken down by region and industry. It was used as inputs to the GBS which calculated the associated biodiversity footprint in MSA.km2 (MSA: Mean Species Abundance).
What were the results?
The static impacts (cumulated losses) amount to 4.8 MSA.km² (more details on MSA.km2 in CDC Biodiversité, 2017). This is equivalent to a 100% loss of Mean Species Abundance over 4.8 km2 (approximately the surface area of the first ten “arrondissements” of Paris). The dynamic impacts (periodic gains or losses) reach 0.06 MSA.km², or an area equivalent to that of 8 soccer fields.
Considering these impacts in the context of portfolio size (EUR 20.1 million) and global annual biodiversity loss (320 000 MSA.km²), the overall impact of the portfolio is limited.
Focusing on the top five highest-impact companies, an intensity of impact was computed: for their Scope 1 impact, it ranges from 0.5 to 2.2 MSA.m²/kEUR of turnover, close to or below the global average intensity of all industries. Considering value chain impacts changes the results quite dramatically. Scope 3 impacts are indeed equivalent or higher than Scope 1 impacts for three companies out of the five, Scope 3 impacts of the company “Hospitality” is three times higher than its Scope 1.
What was the outcome of the assessment, and what impact did it have?
For CDC Biodiversité, the case study confirmed the need to provide tools for asset managers to assess the biodiversity footprint of their investments and helped identify the technical developments needed to adapt to existing data and needs. It was an opportunity to better understand the biodiversity issue in BNP Paribas AM’s activity, to experiment with what future biodiversity disclosure processes could be like and to get a head start on how biodiversity impact information could be useful to their business in the future.
What were the learnings?
Considering the impacts due to companies’ value chains is key to properly estimate the impact of their activities. Another lesson is that data is most often insufficient (industry and region level of detail) and in varying formats. Quite heavy data pre-treatments are needed, which led CDC Biodiversité to elaborate on the guidelines and tools to conduct such pre-treatments.
Next steps:
Financial institutions using the GBS to assess the impacts of their assets on natural capital, and more specifically on biodiversity, can then use the results to engage companies they finance to point at actions to reduce their biodiversity footprint, encourage those companies to set ambitious biodiversity impact reduction targets. They can also seize new opportunities by setting up funds to finance activities with low or positive impacts on biodiversity. And they can also use the information generated to screen out high-impact companies (exclusion).
More information on the tool on the latest GBS report: CDC Biodiversité, 2020


